Our Edge & Tech
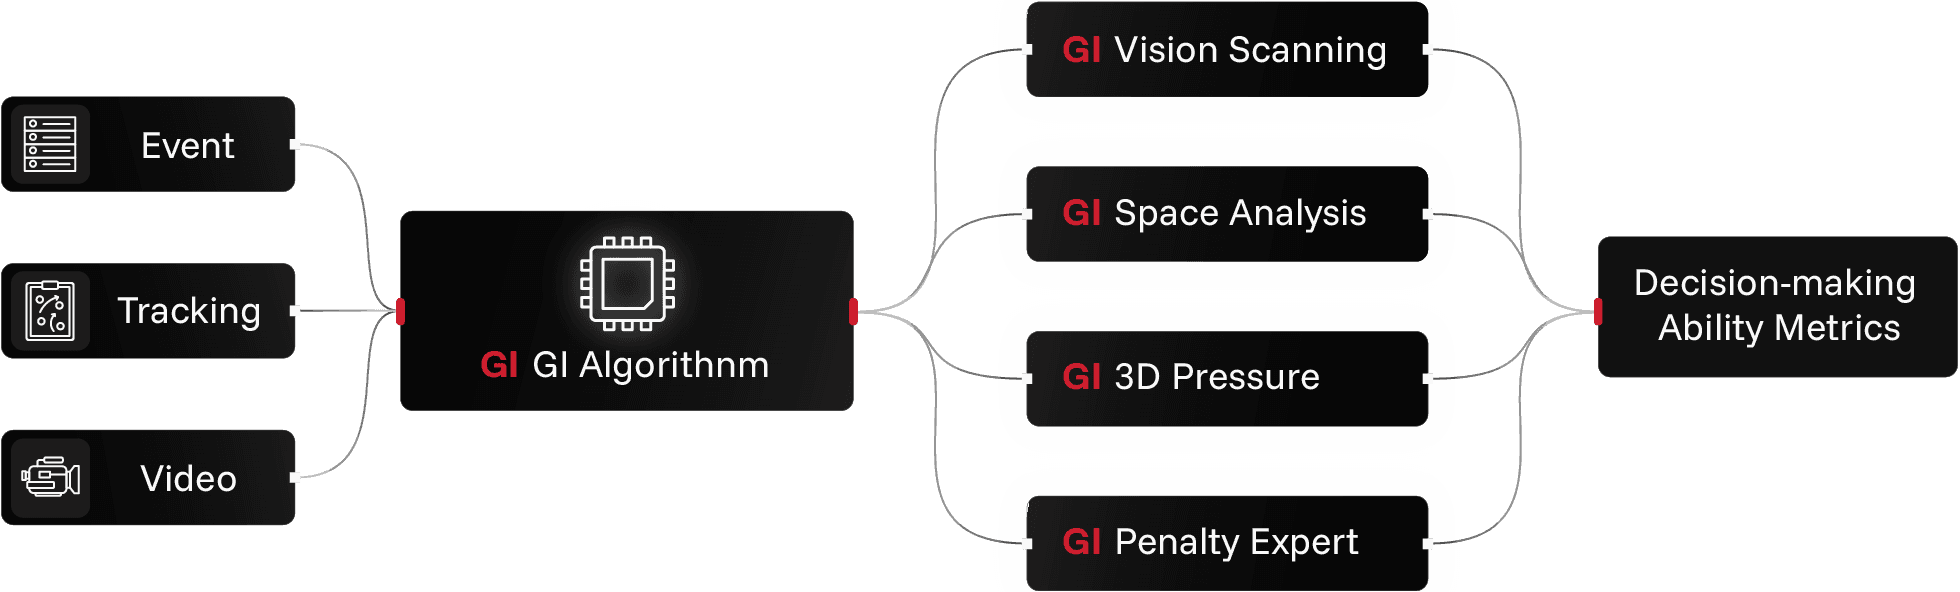
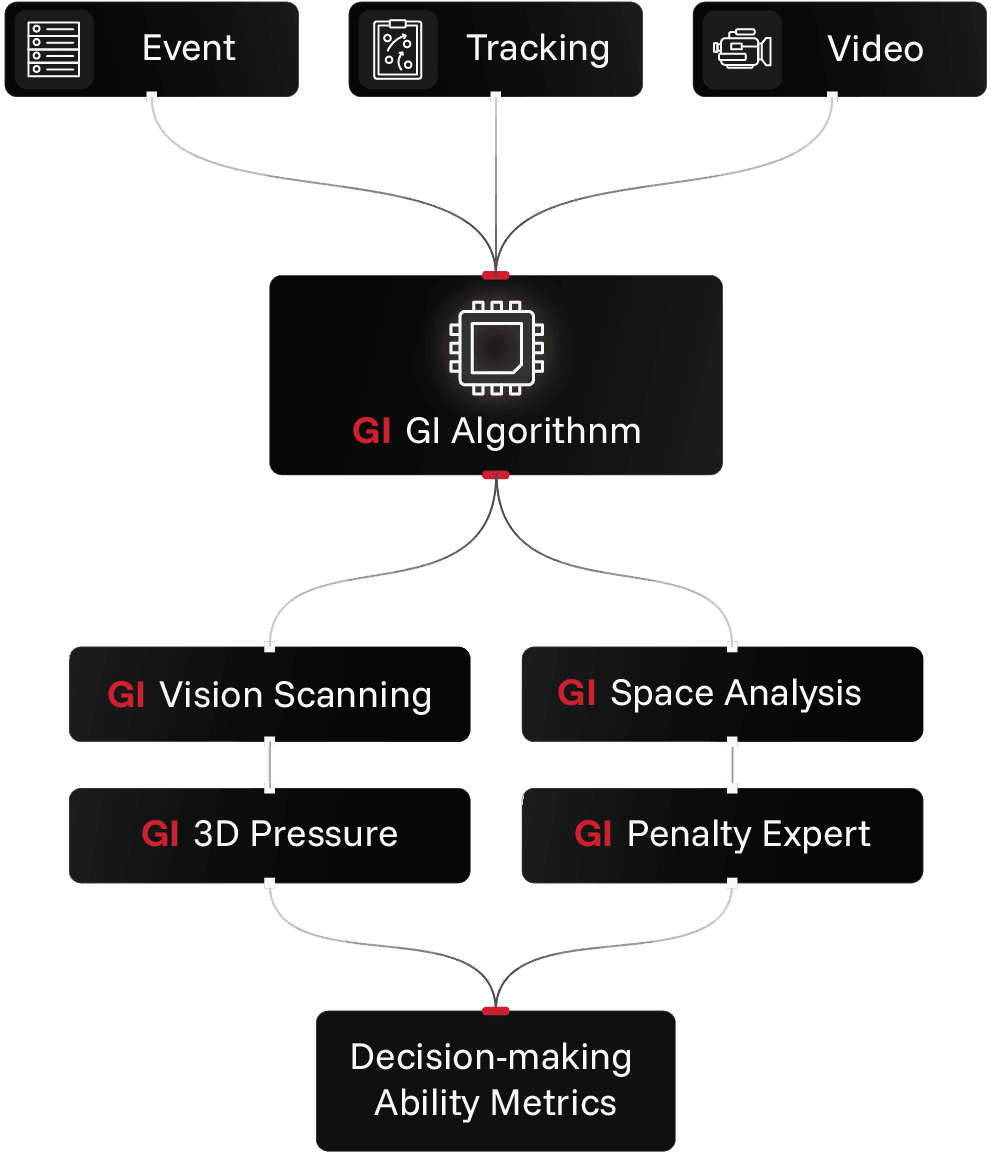
Built for sharper decision-making. Proven by research.
GI
GI
Analysis
Turning match data into measurable game intelligence.
" height="15px" id="MCeIs9T99" width="15px"/></svg>)
GI
GI
Space Analysis
Space Analysis
From tracking data to measuring space intelligence.
Space Creation
Space Activation
OUR TECH EDGE
Quantify Individual Space Decisions
OUR TECH EDGE
Quantify Individual Space Decisions
OUR TECH EDGE
Quantify Individual Space Decisions
WHAT MAKES US DIFFERENT
What Space Analysis Tracks
Space activation tracks
Decision audit: real pass vs optimal pass
Missed opportunities (better options not taken)
High-impact activations
Activation outcomes (progression, scoring chance)
Space creation tracks
Top space creators (by player, role, zone)
Quality of space created (danger/value)
Off-ball space creation
Space creation by phase and zone
space creation & activation,
evaluate behind on-ball and off-ball decisions-making.
space creation & activation,
evaluate behind on-ball and off-ball decisions-making.
space creation & activation,
evaluate behind on-ball and off-ball decisions-making.
OUR TECH EDGE
Track Every Space in Every Play and Every Match
Track Every Space in Every Play and Every Match
GI
GI
3D Pressure
3D Pressure
Accurate pressure quantification, with contextual data.
Most models rely on simple proximity rules and ignore what changes outcomes: body orientation, blocked passing lanes, and disrupted team connections.Our research proven pressure matrix adds these contextual signals to deliver more accurate, coach-ready pressure scores.
Most models rely on simple proximity rules and ignore what changes outcomes: body orientation, blocked passing lanes, and disrupted team connections.Our research proven pressure matrix adds these contextual signals to deliver more accurate, coach-ready pressure scores.
OUR TECH EDGE
Detect What the Eye Can’t See
OUR TECH EDGE
Detect What the Eye Can’t See
OUR TECH EDGE
Detect What the Eye Can’t See
WHAT MAKES US DIFFERENT
What 3D Pressure Tracks
3D Pressure tracks
22-Player contextual data
Positioning and distance
Speed and acceleration
Body angle and movement direction
3D Pressure output
Performance under pressure
Pressure relief efficiency
Dribble score (under pressure)
Pass score (under pressure)
VALUE OF OUR MODEL
Revealing Undervalued Players
Finding hidden players isn’t easy. GI 3D Pressure reveals pressure actions most models miss, helping you identify undervalued players faster and de-risk recruitment.
VALUE OF OUR MODEL
Revealing Undervalued Players
Finding hidden players isn’t easy. GI 3D Pressure reveals pressure actions most models miss, helping you identify undervalued players faster and de-risk recruitment.
VALUE OF OUR MODEL
Revealing Undervalued Players
Finding hidden players isn’t easy. GI 3D Pressure reveals pressure actions most models miss, helping you identify undervalued players faster and de-risk recruitment.
GI
GI
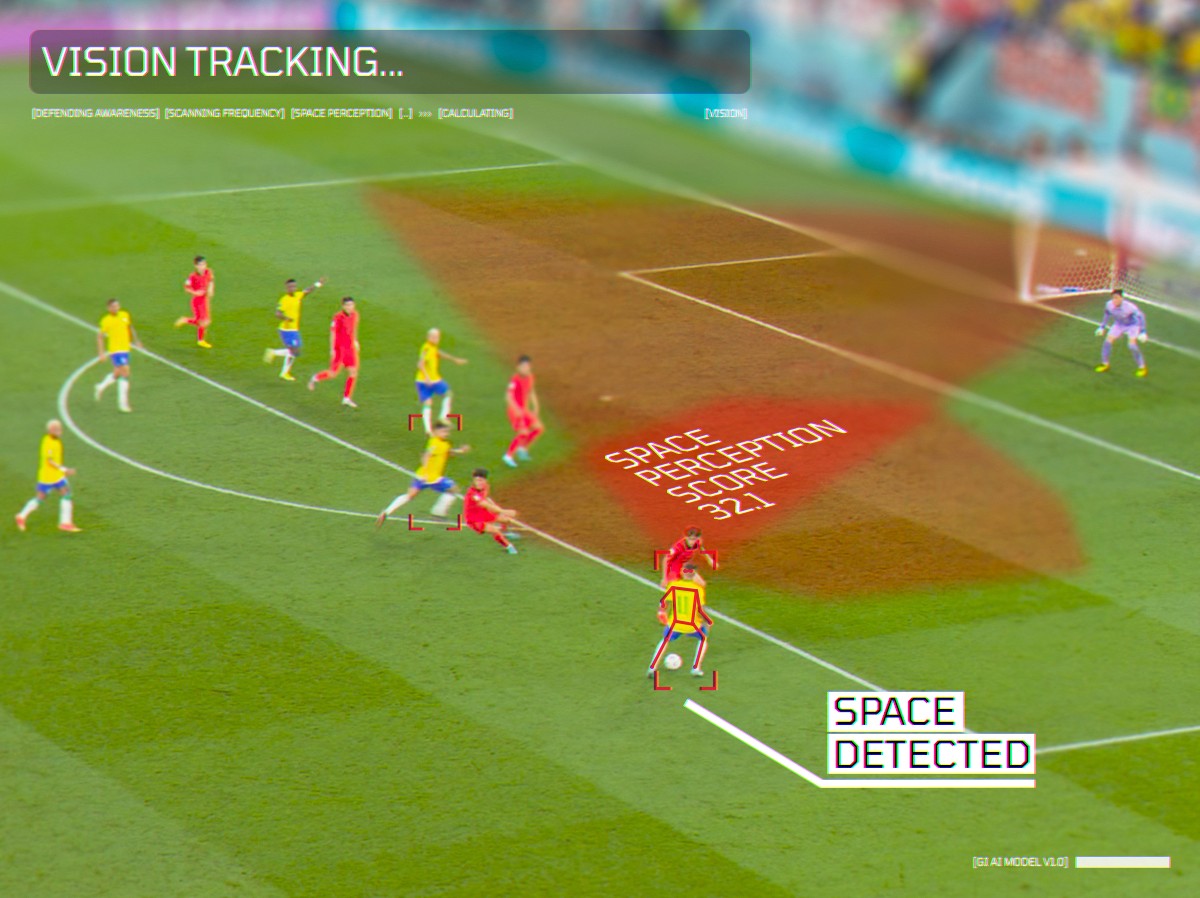
Vision Scanning
Vision Scanning
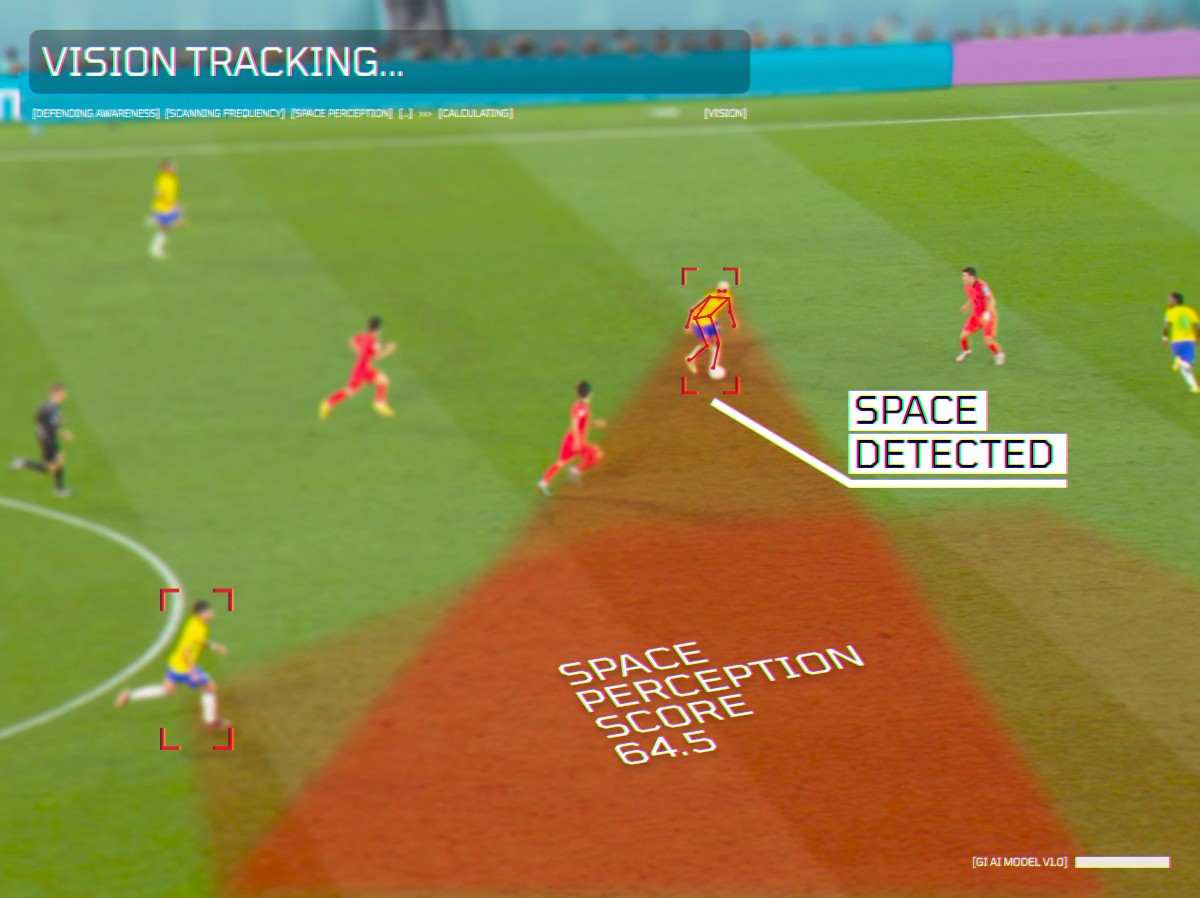
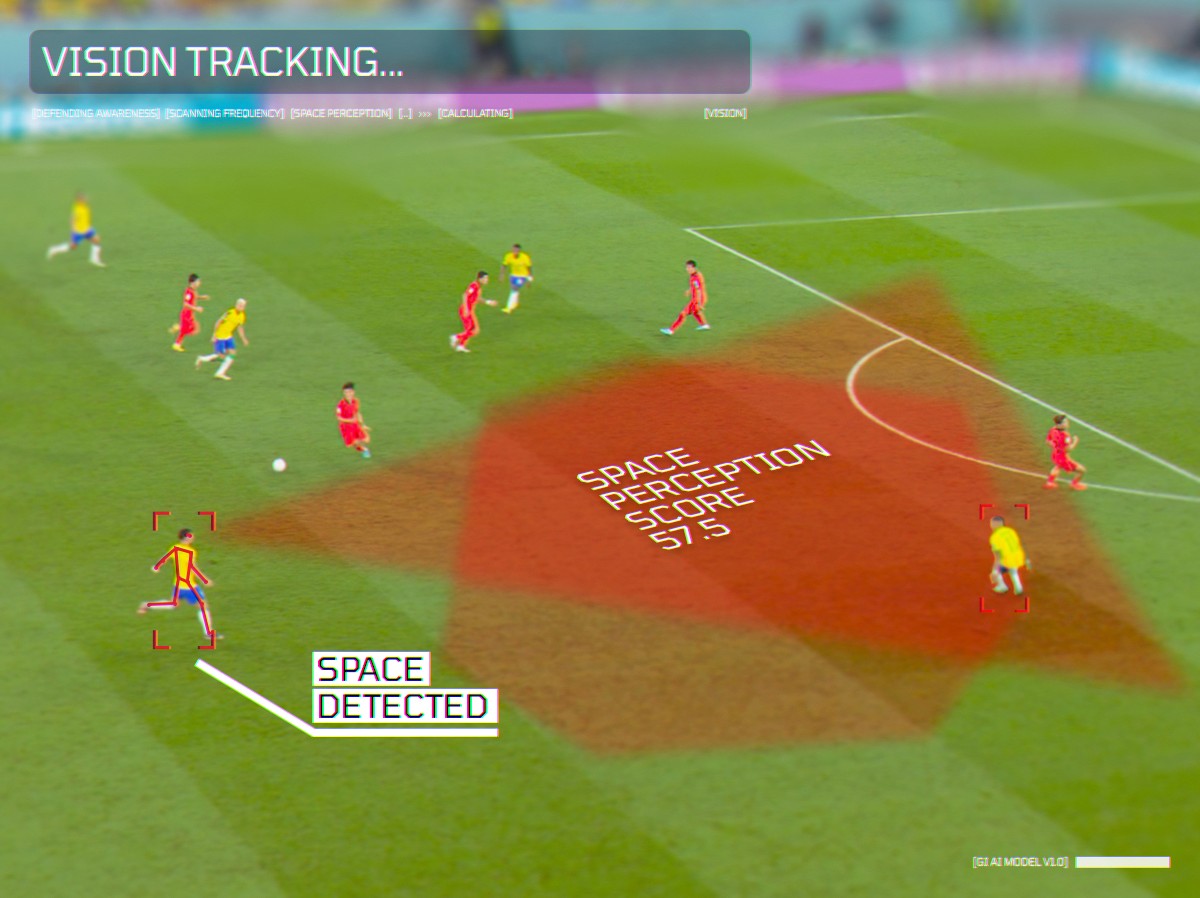
Measure what players see before they receive
• Awareness of defenders and teammates.
• Identification of valuable space.
• Scan frequency.
• How quickly scanning turns into action.
• Awareness of defenders and teammates.
• Identification of valuable space.
• Scan frequency.
• How quickly scanning turns into action.
OUR TECH EDGE
See Where Players Look, Measure How Well They Scan

OUR TECH EDGE
See Where Players Look, Measure How Well They Scan
OUR TECH EDGE
See Where Players Look, Measure How Well They Scan
WHAT MAKES US DIFFERENT
The Value of GI Vision Scanning Model
Add Context to Every Scan
GI Vision links scanning to match context—defender and teammate awareness, space, timing, and the next action—so you understand why decisions happen, not just what happened
Make Pitch Awareness Measurable
GI Vision Scanning turns awareness into a score. See decision-making not only in the pass, but in what players spot before they receive, turn, or play.
Review Faster, Across More Matches
Our AI surfaces key scanning moments automatically, so you can review quicker, cover more games, and compare players with consistent evidence.
Actionable Insights
GI Vision turns scanning data into simple actionable cues: what’s working, what’s missing, and what to train next. Built for coaches and players, so everyone knows the next action.
VALUE OF OUR MODEL
Identify the right player profiles with vision-scanning insights.
Not every player fits your system. Different teams need different strengths to cover specific gaps.
GI Vision Scanning tracks five key scanning measures, so you can identify the player profiles that best match your team’s needs.